









Independent Expert Reports (IERs), or “fair & reasonableness” reports require a valuation of the subject Company. When we write an IER we consider if we can use a listed company’s share price as a valuation method. For this to be feasible, there must be an “active and deep liquid market” for it to be a meaningful guide to company value.
In deciding this, we examine share turnover ratios. A share turnover ratio is the volume of a company’s shares traded over a period, as a proportion of the number of total shares on issue. We examine this for a subject Company on both an overall share trading volume and weighted by market capitalisation (‘cap’) basis.
But, what is usually considered a reasonable level of share turnover liquidity in a listed company?
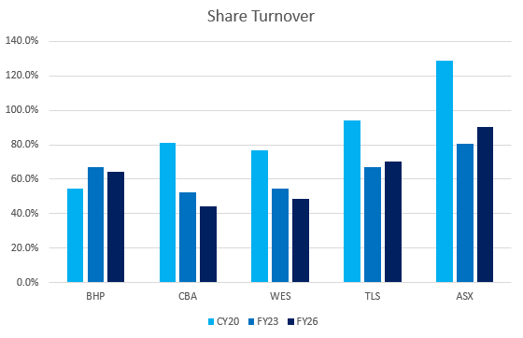
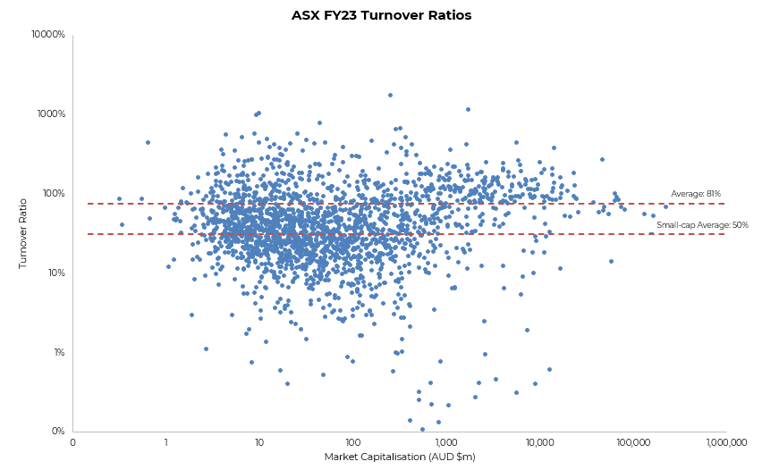
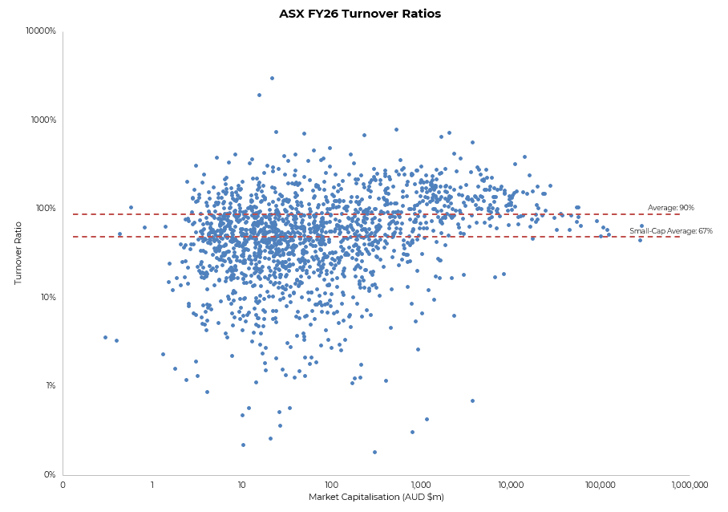
For this example, we calculated the annual share turnover ratio for every ASX-listed stock in FY26. The market-cap-weighted average turnover across the entire market was 90%, meaning that 90% of the total number of shares on issue changed hands within the year. This has increased from 81% turnover in FY23 when we last examined this.
Interestingly, we calculated the same for the 2020 calendar year, which experienced heightened economic (COVID-19) instability. The annual share turnover was much higher, both for all ASX-listed companies at 129%, and for small-cap stocks at 101%. This demonstrates how much large-scale market selloffs and rallies can skew the apparent turnover of shares.
Outside these shocks, we expect the turnover ratio to be less than 100% given that superannuation funds and other institutional investors tend to hold a significant portion of listed shares for longer terms. For example, FY26 stock turnover by large and popular stocks was:
- BHP 64%
- CBA 44%
- WES 48%
- TLS 71%
FY26 Share Turnover for Large and Popular Stock against ASX
Much of the increase FY23 to FY26 in share trading turnover for the total ASX market occurred among smaller ASX companies (<$100m market cap), where the market-cap-weighted turnover rose from 50% in FY23, to 67% in FY26.
Despite this increased trading activity among smaller companies, the median market cap only grew 9.2% within this period, from $41.9 million to $45.8 million, perhaps reflecting a shift toward larger market cap listings. This shift also coincides with a net reduction of 275 ASX-listed companies, reflecting ASIC’s reporting on the shift from public capital raising via IPOs toward private credit.[1] Australia’s new listings are at a decade low, with 557 delistings since FY23 against just 282 IPOs, the total number of listed entities was below 2,000 for the first time since 2022. As companies with less share trading turnover delist, the overall share trading turnover and market cap appears to have trended upward.
Currently, companies with very high (> 100% turnover) tend to be resources companies with exposure to critical metals or batteries (e.g. ASX: AVM Advance Metals). Conversely, there are 313 companies with low turnover (<20% turnover, see chart #3), consisting of a mix of companies sharing no obvious characteristics other than being closely held or unattractive. These closely held companies have market cap ranging from $0.3 million to $8.5 billion, showing no relationship between size and turnover. In FY26, Echelon Resources Limited (ASX: ECH) had just 2.9% turnover with a market cap of $77.3 million and is an example of a closely held company.
FY23 Share turnover % vs Market capitalisation
Note: Log scales are used due to breadth of data.
FY26 Share turnover % vs Market capitalisation
FY26 Share Turnover (<20%) vs Market Capitalisation.
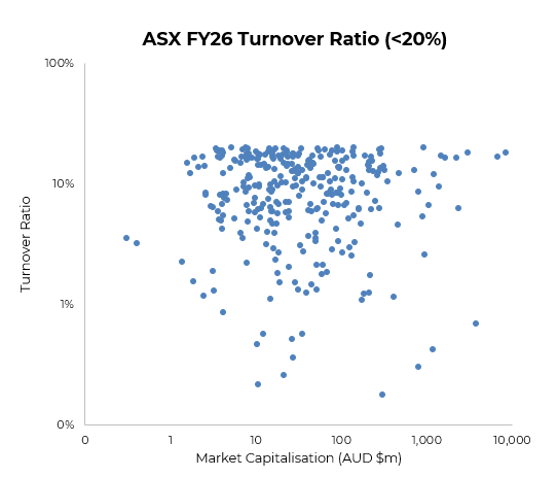
At Moore Australia, we tend to write IER’s on companies with smaller market capitalisations. I view CY2020 data of 101% as abnormal and FY23 and FY26 data of 50% to 67% as more usual. From Chart 4 above there appears to be a reasonable spread of <$100m market capitalisation companies with share turnover in the 10%-20% range.
However, on balance, I think that share trading turnover volumes below 15% would indicate some concern on the reliability of using the share price as a guide to value.
Of course, there are other factors to consider when determining whether a stock is liquid, including:
- Buy/sell spreads (market depth),
- Ownership and the level of free float,
- Size or pattern of trades in the period. For example, if trading activity was isolated to a few big trades or was spread throughout the year.
Whilst a share with a trading turnover volume of below 15% means that we probably cannot use the share price as a guide to value, we should not ignore it outright. It means that we would likely adopt another valuation method as our primary approach (e.g. an income or asset-based method). If that approach was significantly different from the implied market capitalisation, it may cause us to consider whether our primary approach is plausible, or if there are other reasons for the difference.
Therefore, our expertise and judgement as the valuer is required for the circumstances. There may not always be a firm answer on where the ‘cut-off’ on share turnover liquidity sits.
If you would like to discuss this further, Moore Australia has valuation experts across the network. Please contact us today to find out more.
[1] Australia’s Evolving Capital Markets: A Discussion Paper on the Dynamics Between Public and Private Markets – February 2025: ASIC.